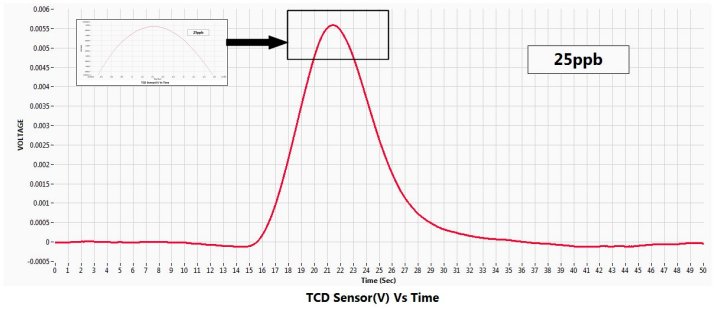
HEMS-M CO High Resolution Plot and Data at 25 ppb
HEMS-M Carbon Monoxide (CO) High Resolution Plot and Data at 25 ppb Click on one of the Plot Points in the above graph or one of the links below to view a specific test result chart in the range of…
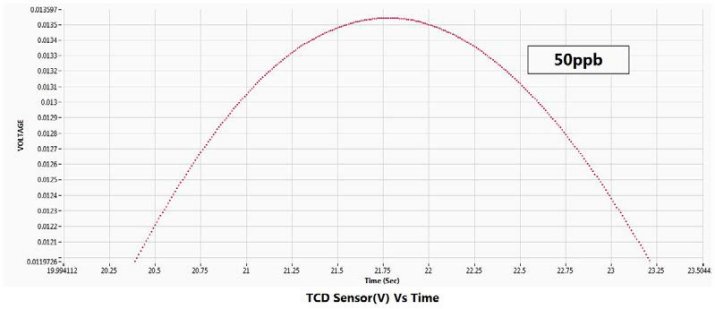
HEMS-M CO High Resolution Plot and Data at 50 ppb
HEMS-M Carbon Monoxide (CO) High Resolution Plot and Data at 50 ppb Click on one of the Plot Points in the above graph or one of the links below to view a specific test result chart in the range…
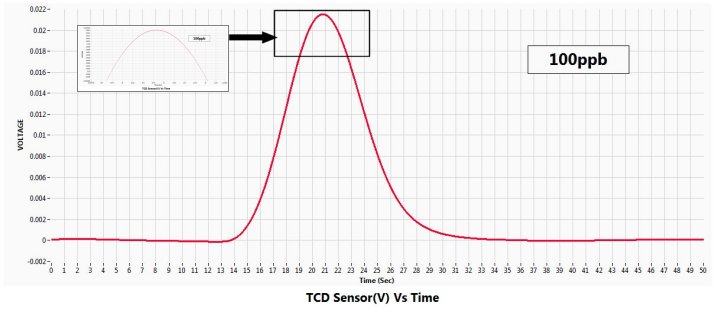
HEMS-M CO High Resolution Plot and Data at 100 ppb
HEMS-M Carbon Monoxide (CO) High Resolution Plot and Data at 100 ppb Click on one of the Plot Points in the above graph or one of the links below to view a specific test result chart in the range…
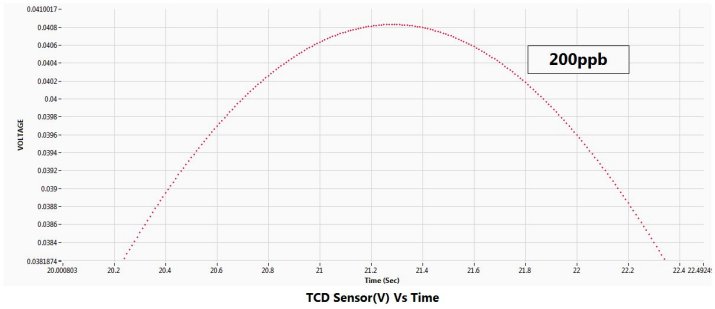
HEMS-M CO High Resolution Plot and Data at 200 ppb
HEMS-M Carbon Monoxide (CO) High Resolution Plot and Data at 200 ppb Click on one of the Plot Points in the above graph or one of the links below to view a specific test result chart in the range of…
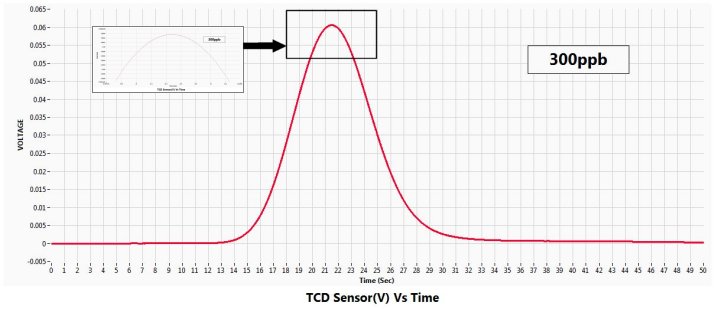
HEMS-M CO High Resolution Plot and Data at 300 ppb
HEMS-M Carbon Monoxide (CO) High Resolution Plot and Data at 300 ppb Click on one of the Plot Points in the above graph or one of the links below to view a specific test result chart in the range…
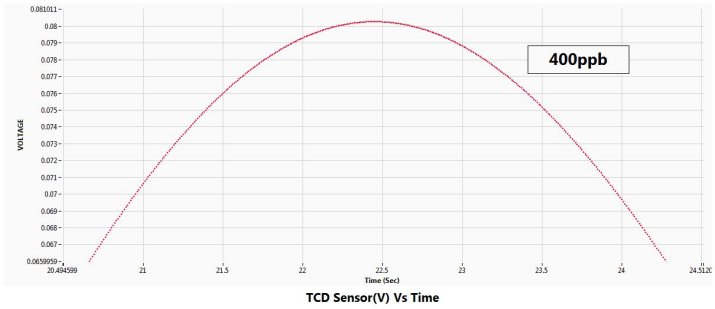
HEMS-M CO High Resolution Plot and Data at 400 ppb
HEMS-M Carbon Monoxide (CO) High Resolution Plot and Data at 400 ppb Click on one of the Plot Points in the above graph or one of the links below to view a specific test result chart in the range…
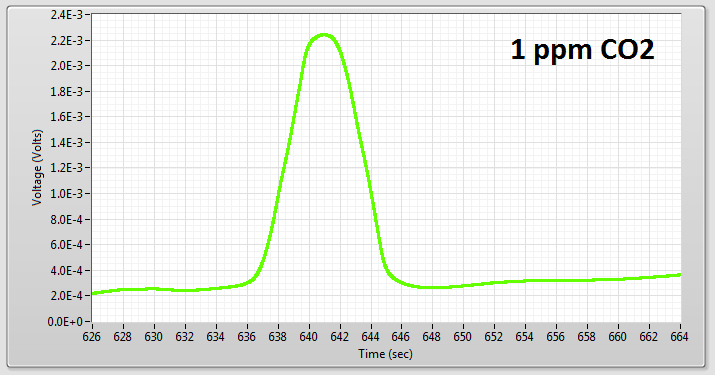
HEMS-M CO2 High Resolution Plot and Data at 1ppm
HEMS-M CO2 High Resolution Plot and Data at 1ppm [embeddoc url=”http://www.powerandenergy.com/wp-content/uploads/1ppmCO2.xlsx” download=”none” viewer=”microsoft”] [small_button text=”Download Plot and Data…” title=”Download Plot and Data” url=”http://www.powerandenergy.com/data-plot-download-access/” align=”left” target=”_self” style=”light”] [small_button text=”Back to Plot and Data Index” title=”Back to Plot and Data Index”…
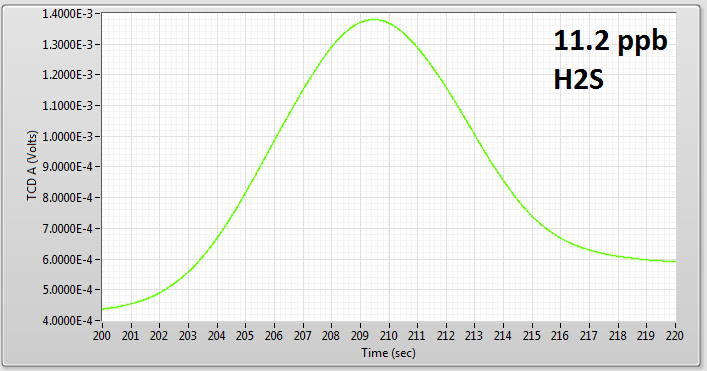
HEMS-M H2S High Resolution Plot and Data at 11ppb
HEMS-M H2S High Resolution Plot and Data at 11ppb [embeddoc url=”http://www.powerandenergy.com/wp-content/uploads/11ppbH2S.xlsx” download=”none” viewer=”microsoft”] [small_button text=”Download Plot and Data…” title=”Download Plot and Data” url=”http://www.powerandenergy.com/data-plot-download-access/” align=”left” target=”_self” style=”light”] [small_button text=”Back to Plot and Data Index” title=”Back to Plot and Data Index”…
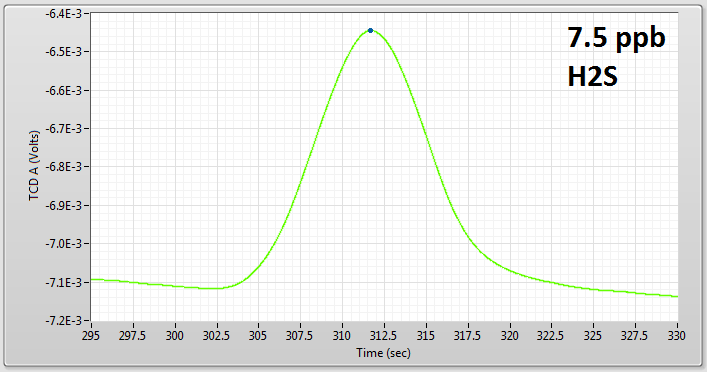
HEMS-M H2S High Resolution Plot and Data at 7.5ppb
HEMS-M H2S High Resolution Plot and Data at 7.5ppb [embeddoc url=”http://www.powerandenergy.com/wp-content/uploads/7.5ppb-H2S.xlsx” download=”none” viewer=”microsoft”] [small_button text=”Download Plot and Data…” title=”Download Plot and Data” url=”http://www.powerandenergy.com/data-plot-download-access/” align=”left” target=”_self” style=”light”] [small_button text=”Back to Plot and Data Index” title=”Back to Plot and Data Index”…